Intro:
The goal of this lab was to employ filtering to be able to detect IR signals of other robots in the maze and determine when the appropriate tone has been played to begin maze tracing.
Detecting the IR Signal:
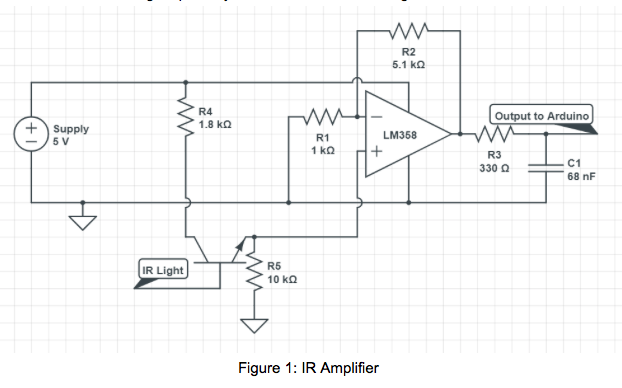
In order to amplify and filter the signal, we built a non-inverting amplifier using the LM358 chip, with about six times gain, as R1 was 1 kΩ and R2 was 5.1 kΩ. We built a low pass filter on the output using a 330 Ω resistor and a 68 nF cap. Initially, the op amp had just a dc output, because the phototransistor had too high an impedance and the op amp was receiving a small AC signal at a nearly 5 volt offset. To account for this, we attached the negative leg of the phototransistor -- which was initially grounded -- to the positive input of the op amp, and attached a 10 kΩ resistor to ground, to force the AC signal to be more comfortably within the 0-5 Volt range. This way, when the phototransistor was getting more signal, its impedance would drop and the voltage at the input would increase. The low pass filter on the output has a cutoff frequency of approximately 7100 Hz, which allows the 6 kHz signal to pass comfortably through, untouched, but should reduce the magnitude of the 18 kHz decoys by 11 dB. This means that if the value of a nearby robot should be the largest peak by far when it is within a range that it needs to be avoided at.
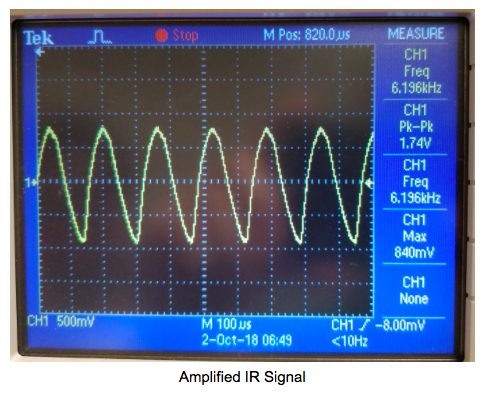
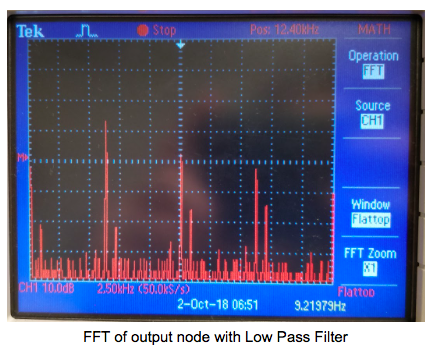
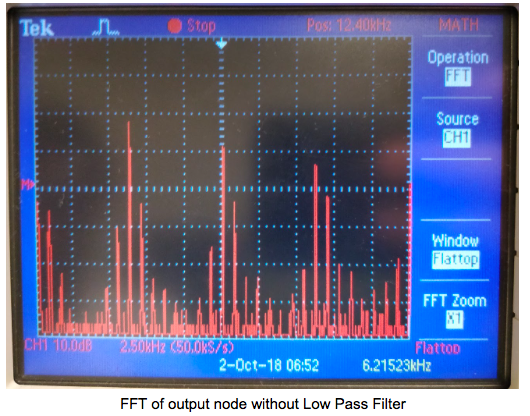
The IR output of the LED has several harmonics that have significant magnitude, but adding in the LPF to the circuit helps remove them. Since it is not a perfect sinusoid, it has many other frequencies in its waveform that show up on the FFT and can make processing more difficult. The low pass filter helps remove the error frequencies closest to the main harmonics, but does little to suppress the overtone harmonics. It gives between 5 to 10 dB of rejection at the second overtone of about 18 kHz, for a total of around 15 dB, but when there is an 18 kHz signal being picked up as well, the 18 kHz signal will dominate the FFT. This bin can simply be ignored in software, but a hardware solution would be adding one or two more low pass stages to increase rejection.
The algorithm started with testing the fft_adc_serial example code. After verifying that the code worked as intended a MATLAB script was developed in order to see the output of the code in real time so that it could be debugged. The MATLAB script started similar to the recommended script in the lab 2 handout except with the notable change of the baudrate from the recommended 9600 to 115200 as the example arduino script used the latter baudrate. After that the script needed to be edited in order to plot the results in real time. An if statement nested in a while loop was all that was needed to display the data.

The initialized variables were the serial port, the string that would keep the serial port data (str), the numeric conversions of the serial port data (sen), the data to be plotted (accX), and the loop variables. Within the while loop a few things needed to be done before the if statement. The variable str had to be set to the data from the serial port. Then sen was set to the data converted to a number. The two variables accX and x are the data to be plotted and the length of the plot. They depended on the loop variable j.
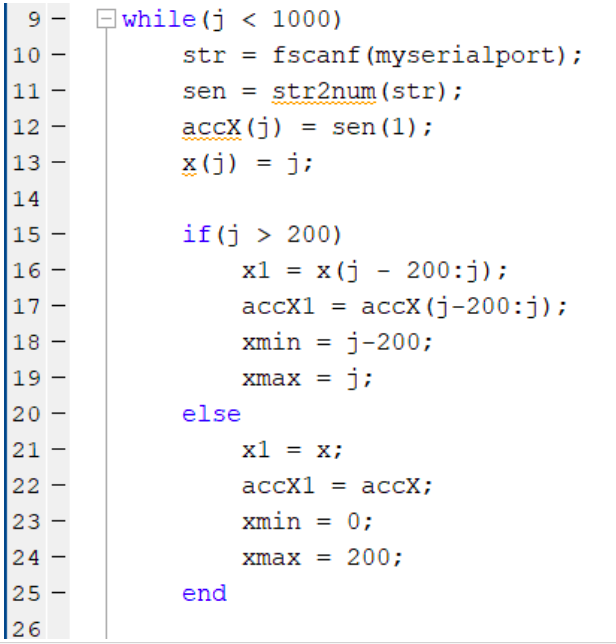
The if statement was responsible for adjusting the size of the real time plot. It would display 200 data points. The variable x1 would ultimately serve as the current x value of the plot. accX1 was the y axis. Note that the variables ranged from j-200:j when j > 200 and the variables were simply assigned to the initiated values when j < 200. This is so that the graph wouldn’t stretch as it plotted. The rest of the while loop was very straightforward. It simply plotted x1 and accX1, set the axis and incremented the loop variable (j).
Lastly, the example code was edited in order to detect the correct frequency. At the end of the code 2 more variables were created called maximum and ind. Another for loop was created that was identical to the previous one except that i was initialized to 10 to avoid the noise at the beginning of the sample. Within it it would set maximum such that it would be the highest value of the fft_log_out array, and it would set ind as the index of the maximum value. The amplifier and sensor was hooked up to the circuit, and it was tested.
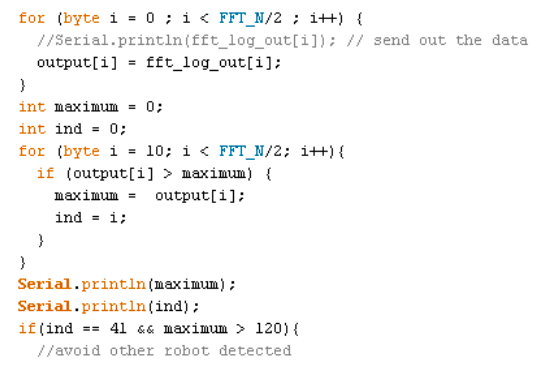
It turned out that the index of the 6kHz signal was in bin 41. By knowing when bin 41 had the maximum signal, we could know exactly when the signal was detected.
Detecting the 660 Hz Tone:
When playing a tone into the microphone, the signal received is around 10-20 mVpp. The microphone output also contains a DC offset that is based off of a voltage divider circuit. This is to lower the DC value in order to avoid saturation at 5 V after passed into the amplifier.
Filtering:
We designed our bandpass filter using one low pass RC filter that then passes the signal to a high pass RC filter. Since we want to filter out frequencies above and below 660 Hz, we calculated resistor and capacitor values to set the cutoff frequencies. The lowpass filter is set to cutoff around 800 Hz and the high pass filter cutoff frequency is around 300 Hz. Using the function generator, we pass in a 660 Hz sinusoid and check the output FFT using the oscilloscope. Without the filter, there is some high frequency noise and some lower frequency components in the signal, but once we pass the signal through the filter we see a much cleaner FFT with a single peak located at 660 Hz. Initial tests with the signal generator also showed us that the free running ADC sampling frequency made the frequency bins about 150 Hz wide, which we narrowed by instead using analogRead to slow down the sampling rate. Now, we can instead see the peak occur around index 20, making it easier to detect the 660 Hz frequency amongst the lower frequency components. However, when connecting the filter stage to the amplification stage discussed later, it was found that the gain was almost entirely removed. Thus, the filtering was removed and the system still functioned well. In the future if there becomes a concern with other noise skewing our detection we can add the filter back in to the circuit and possibly add another amplification stage.
Amplification:
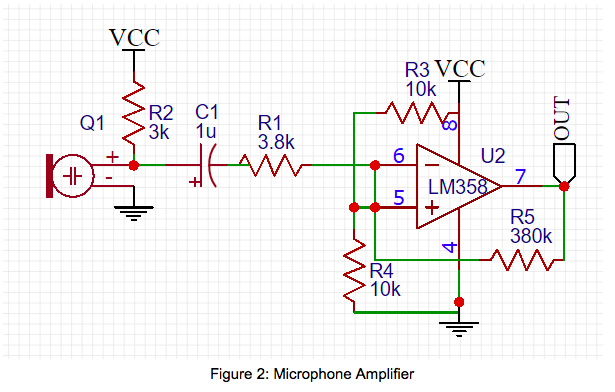
In order to have a detectable signal from the microphone, the initial output needed to be amplified, as otherwise the frequency components were near undetectable. In order to accomplish this amplification, an inverting amplifier was used (Figure 2). The amplification stage employed two resistors to give a theoretical gain of 100; however, due to imperfections in the circuit, the true output that reaches the Arduino was amplified ~90 times .
Software:
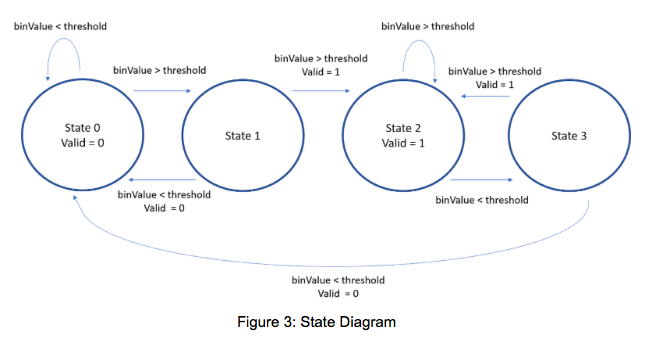
The software employed in the audio sensing employed the FFT library provided as well as a simple means of ensuring a positive that couldn’t be easily faked. The FFT library was used in order to break down the collected samples from the microphone (after being amplified). The resulting Fourier coefficients of the signal were distributed into bins that each had a span of ~33 Hz. This spacing was due to the implementation using analogRead instead of the ADC, thus giving a better spacing of frequencies, while still allowing an analysis of frequencies well past 660 Hz. The implication of this spacing was that the bin which would indicate the 660 Hz signal was the 20th (with zero indexing). In order to read this bin and prevent from false positives, a basic state machine was implemented. In each of the main loop, a function, stateMachine, is called to update the state based on a condition. The condition is simply a thresholding on the bin, where if the value of the bin is over the threshold, the state machine progresses towards or stays in the state that indicates a valid input. A full diagram of the state machine can be seen in Figure 3 with the transitions labeled as well. Once the detection of the signal was determined to be valid, the indication was simply to print that the 660 Hz signal had been detected to the serial port. Otherwise, the only thing displayed was a print of “.....”. A video of the working Microphone circuit can be seen below.
Microphone Circuit Function
Final System:
The final implementation was able to successfully detect the 660 Hz tone when played, and remain untriggered when exposed to ambient noise in lab. As shown in the video, the serial monitor initially outputs dots to show that no 660 Hz tone is detected. Once we transmit the 660 Hz sound, the serial monitor prints the “660 Hz detected” line and we can also see the 660 Hz frequency component on the FFT using the oscilloscope. Even with the background noise in the lab, the op amp is able to provide sufficient gain such that the 660 Hz component is much higher than the noise at other frequencies. The combined system first attempts to detect the 660 Hz tone. Once the tone is detected, we change the ADC back to free running mode with sampling frequency around 38 kHz for IR sensing. This allows us to detect the much higher frequencies from other robots at 6.08 kHz. With the code combined, we can start the robot and continue with IR sensing throughout the maze.
Full System